See the Complete List of States
Download the Q3 report to see the average cost of insurance and how each factor impacts rates in every state
Call a licensed agent: 833-964-9663
How geography, age, vehicle, gender, credit score, coverage level, and adding a driver impacts your insurance rates in each state.
Last Updated: July, 2023
We analyzed carrier rates across ~33,000 zip codes in the United States using public rate filings obtained by analytics company First Interpreter. We then modified our base profile to show how different factors impacted car insurance rates, including the following:
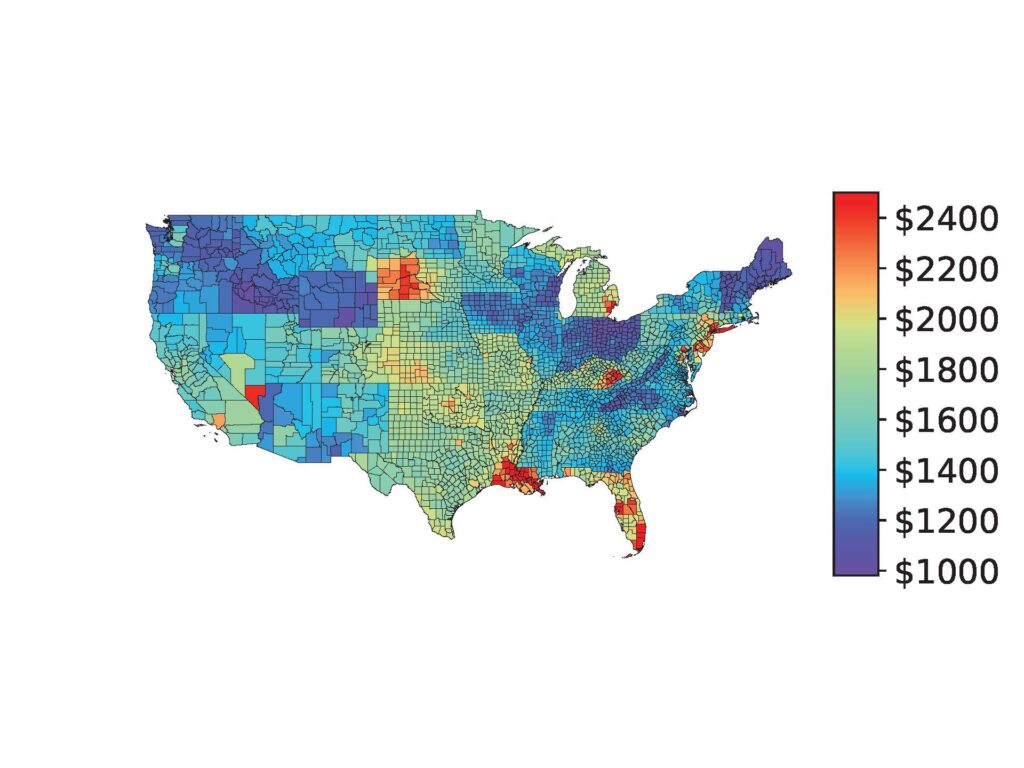
National average cost of car insurance in the US: $1,824 a year
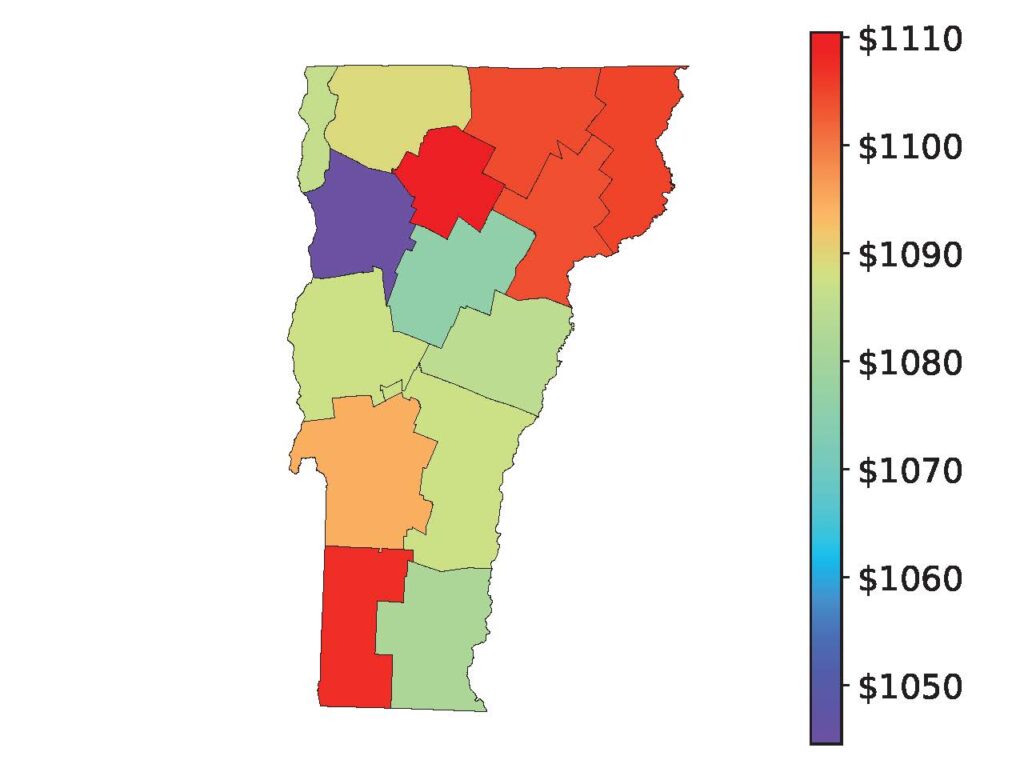
The average cost of car insurance in Vermont is $1,078 per year, which is 40.9% less than the national average.
The Vermont zip code with the highest insurance rates is Killington, VT ($1,129/yr) while the least expensive is Essex Junction, VT ($1,008/yr).
Other cheap states for car insurance: Idaho, Maine, Ohio, Wyoming.
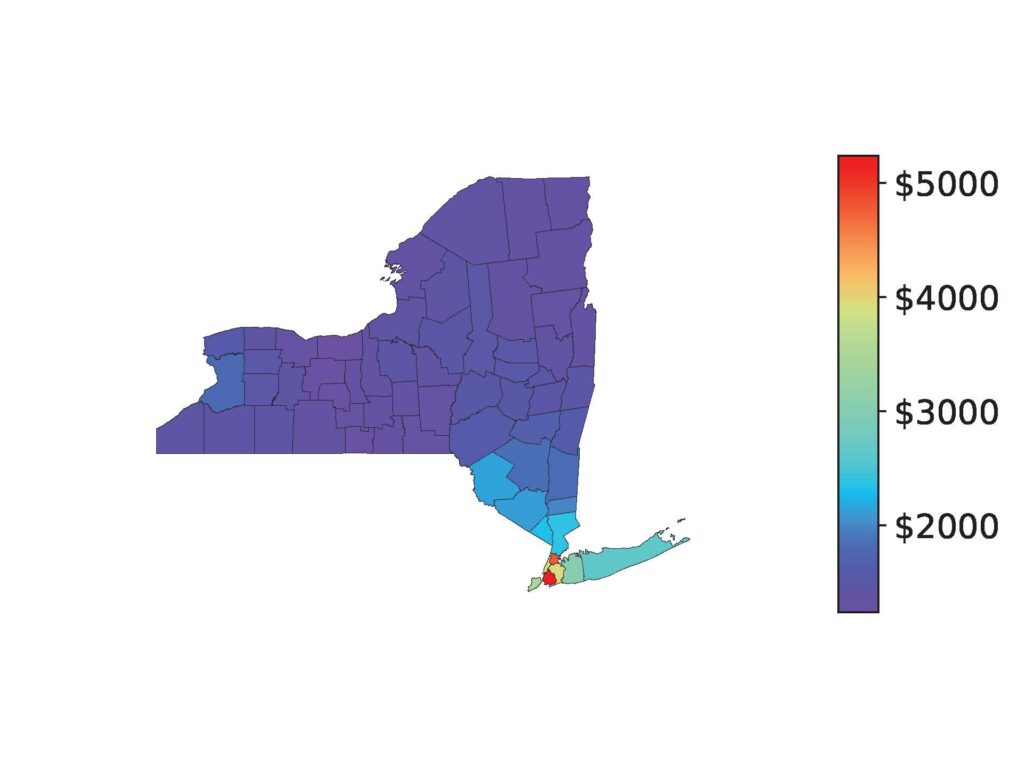
The average cost of car insurance in New York is $3,061 per year, which is 67.8% more than the national average.
The New York zip code with the highest insurance rates is Brooklyn, NY ($5,512/yr) while the least expensive is Conklin, NY ($1,160/yr).
Other expensive states for car insurance: Louisiana, Florida, New Jersey, Delaware.
Download the Q3 report to see the average cost of insurance and how each factor impacts rates in every state
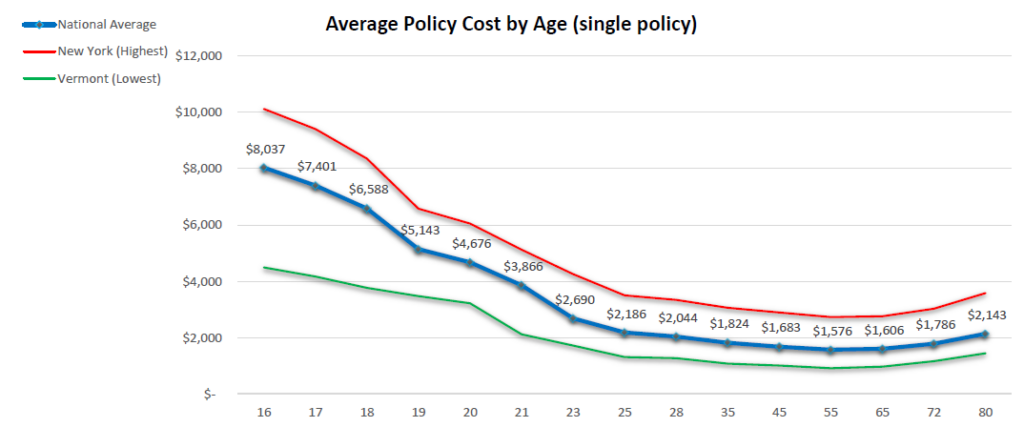
Teen and young adult drivers will pay the most for car insurance, with their rates stabilizing around age 25. Most drivers will have their lowest car insurance rates between ages 45-65. Seniors age 70 and older may see a small increase in their rates each year. This trendline is the same across most states.
This will vary state to state, but on average males pay more than female drivers for car insurance. For example, in Alaska, females pay 3% less than males while in Utah, females pay 5% more. The use of gender as a rating factor is limited or banned in California, Hawaii, Massachusetts, Michigan, North Carolina, and Pennsylvania.
On average, those with excellent credit pay 17% less than those with good credit, and drivers with poor credit pay up to 84% more.
| Avg Annual Premium | Impact on Cost | % Impact | |
|---|---|---|---|
|
Good Credit |
$1,824 |
|
|
|
Excellent Credit |
$1,512 |
-$312 |
-17% |
|
Fair Credit |
$2,243 |
$419 |
+23% |
|
Poor Credit |
$3,358 |
$1,534 |
+84% |
The impact of credit score on insurance rates also varies by state. For example, in Connecticut drivers with a poor credit rating pay about double what drivers with good credit pay while drivers with excellent credit pay 31% less.
California, Hawaii, and Massachusetts prohibit the use of credit-based insurance scores. In Maryland and Michigan, the role of credit score in insurance rates is limited.
The amount of coverage a policy provides impacts the price of car insurance. On average, a policy with the legal minimum coverage saves drivers 60%. However, most drivers want a full coverage policy that covers their own property in a covered incident.
For a policy with 100/300/100 and a $500 deductible, the average annual premium is $1,824. When the limits are lowered to 50/100/50 with a $500 deductible, drivers only save around $10 a year on average. This suggests that lowering your coverage does not always save you money.
This also varies based on location, especially because the legal minimum coverage is different for each state. Download the quarterly report to see how coverage levels impact premiums in your state.
The cost of car insurance depends on the vehicle’s make, model, year, and trim level. SUVs, minivans, and trucks tend to be cheaper to insure than sedans, sports cars, and luxury vehicles. Older vehicles and vehicles with lower trim levels also tend to be cheaper to insure than new vehicles or vehicles with additional features and value.
For the base models of the 100 most popular 2023 vehicles, the average cost of car insurance is $2,129 a year.

The average cost of car insurance for a 2023 Subaru Outback is $1,737 per year, which is 18% less than the average 2023 vehicle.
Other inexpensive vehicles: Subaru Forester, Mazda CX-5, and Volkswagen Tiguan.

The average cost of car insurance for a 2023 Tesla Model S is $4,048 per year, which is 90% more than the average 2023 vehicle.
Other expensive vehicles to insure: Tesla Model Y, Dodge Charger, and Tesla Model 3.
Download the Q3 report to see the average cost of insurance for each of most popular 2023 vehicle models
On average, married couples save 23% on their car insurance when they combine their policies. If they share a vehicle, their savings reach up to 53%.
| Avg Annual Premium | Impact on Cost | % Impact | |
|---|---|---|---|
|
Married couple; separate policies |
$3,645 |
|
|
|
Married couple; joint policy (2 vehicles) |
$2,797 |
-$848 |
-23% |
|
Married couple ; joint policy (1 vehicle) |
$1,716 |
-$1,929 |
-53% |
For most parents, adding a teenager to their existing car insurance policy will be cheaper than purchasing a separate policy for the teenager. In fact, a parent that shares their vehicle with their teenager will save 54% when they add the teen to their policy rather than purchasing a separate policy for the teen driver. When the teen has their own vehicle, the pair will save 36% with a shared policy.
| Avg Annual Premium | Impact on Cost | % Impact | |
|---|---|---|---|
|
Parent Only |
$1,693 |
|
|
|
Teen Only |
$7,401 |
|
|
|
Parent + Teen (1 vehicle) |
$4,189 |
-$4,905 |
-54% |
|
Parent + Teen (2 vehicles) |
$5,823 |
-$3,271 |
-36% |
Rate Retriever is the go-to destination for comparing car insurance rates from top providers. Our super simple tool helps drivers find savings in just 30 seconds by comparing the cost of car insurance at companies near them. It’s free and no sign-up is required.
Rate Retriever estimates rates based on public rate filings obtained by analytics company First Interpreter. This data comes from the rating plans insurance carriers submit to each state’s department of insurance.
For this report, we analyzed carrier rates across ~33,000 zip codes in the United States. Calculations were weighted by each zip code’s population for accuracy. Data is shown on maps by county for simpler visualization. The Geography table for each state highlights popular cities (we picked a single zip in each) to show how location impacts policy cost. We also included the highest and lowest rated zips in each state.
Our base profile is a 35-year-old single male with a clean driving record and good credit score, driving a 2022 RAV4. We modify this profile by sex, credit score, age, marital status, homeowner status, and vehicle model to produce the data in this report.
Our base profile has a premium full coverage policy with the following limits:
These are sample rates and should be used for comparative purposes only.
As we strive to be the most trusted resource for comparing insurance rates, we invite you to explore our findings, and should you choose to reference them, kindly provide proper attribution to “Rate Retriever” or “RateRetriever.com” and include a link to this page or rateretriever.com for more information.
For any inquiries, assistance, or additional data, feel free to reach out to us at [email protected]. We are able to provide local data for any of the factors analyzed in this report.